Statistical Checks
ReviewerZero's statistical analysis module helps identify inconsistencies and errors in reported statistics. Based on our internal analysis of millions of articles, approximately 1 in 3 papers with statistical claims contains at least one detectable statistical inconsistency.
Why Statistical Checks Matter
Picture this: A groundbreaking medical study claims a new drug reduces blood pressure by 30%. The result hinges on a single sentence: "statistically significant, t(38) = 2.21, p = 0.0332". Journals accept it. Headlines announce it. High-risk patients get their hopes up.
But what if the statistics are wrong?
Studies show that 1 in 5 psychologists admitted to the questionable research practice of "rounding down" a p-value to make it appear smaller. Our automated system catches these issues before they become problems.
Contextual Analysis
Review statistical analyses directly within the manuscript context. Detailed explanations help reviewers understand and evaluate potential issues with confidence.
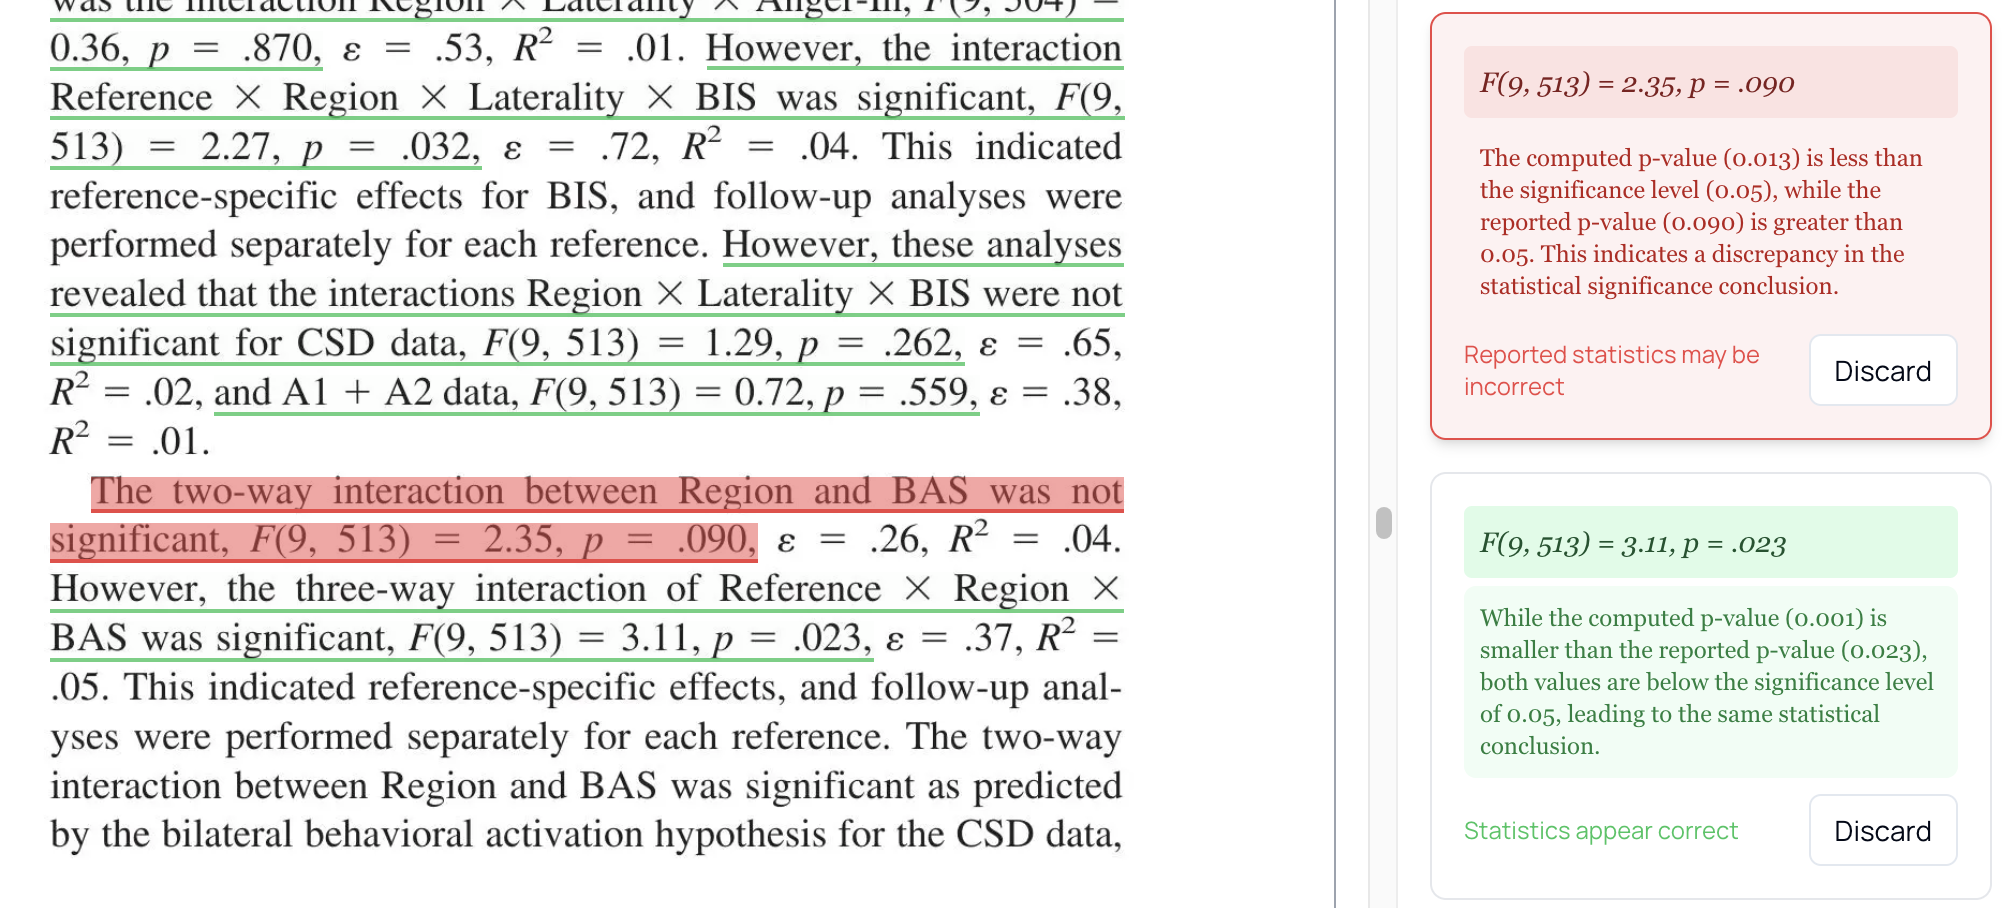 Contextual Statistical Analysis
In-Context Features
- Click on any statistical claim to see analysis
- View explanations alongside original text
- Navigate between flagged issues easily
- Access recalculated values directly
False Positive Prevention
Our system intelligently identifies and filters out false positives caused by rounding differences.
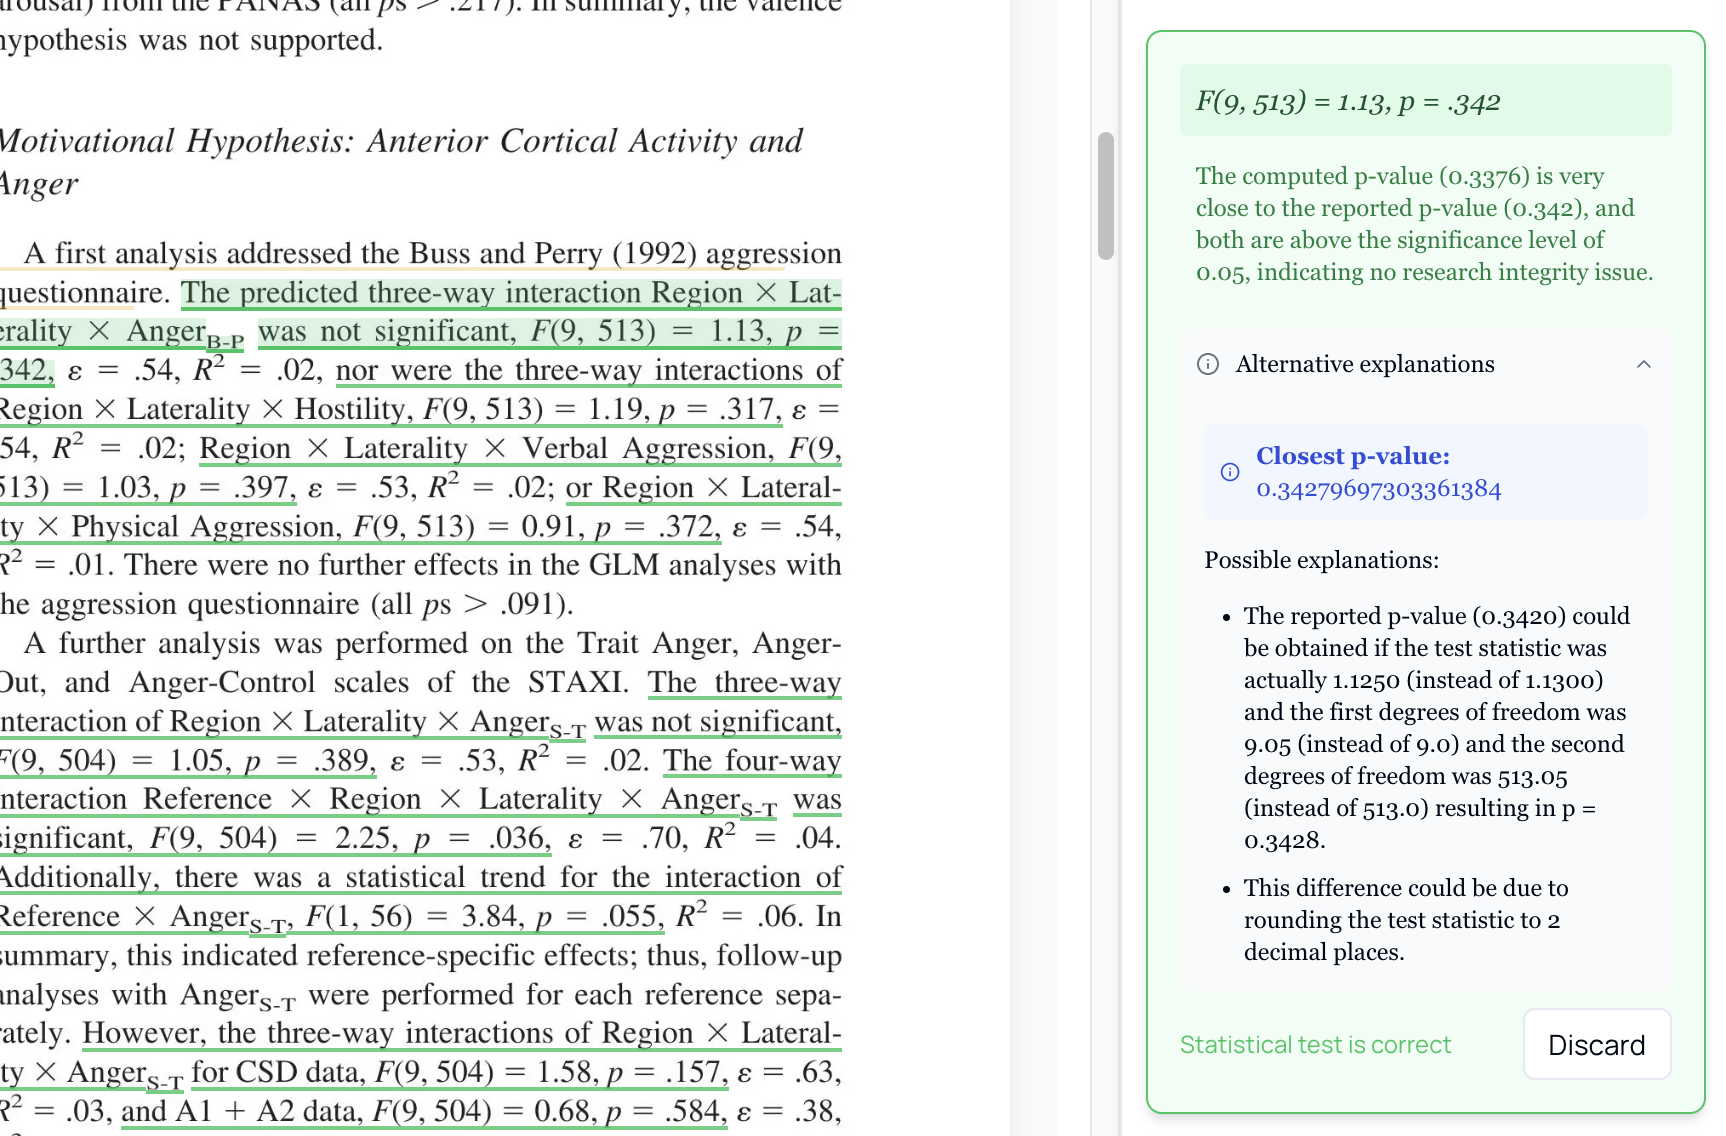 False Positive Prevention
How We Reduce False Positives
- Rounding Pattern Detection - Recognize common rounding conventions
- Tolerance Thresholds - Allow for minor numerical variations
- Context Awareness - Consider how values are typically reported
- Multiple Verification - Cross-check against different calculation methods
Rounding Considerations
| Reported | Computed | Status |
|---|---|---|
| p = 0.02 | p = 0.021 | Acceptable rounding |
| p < 0.001 | p = 0.00089 | Acceptable inequality |
| p = 0.05 | p = 0.06 | Potential decision error |
| p < 0.05 | p = 0.06 | Significant discrepancy |
Statistical Overview
Quick overview of statistical findings with clear explanations and actionable insights.
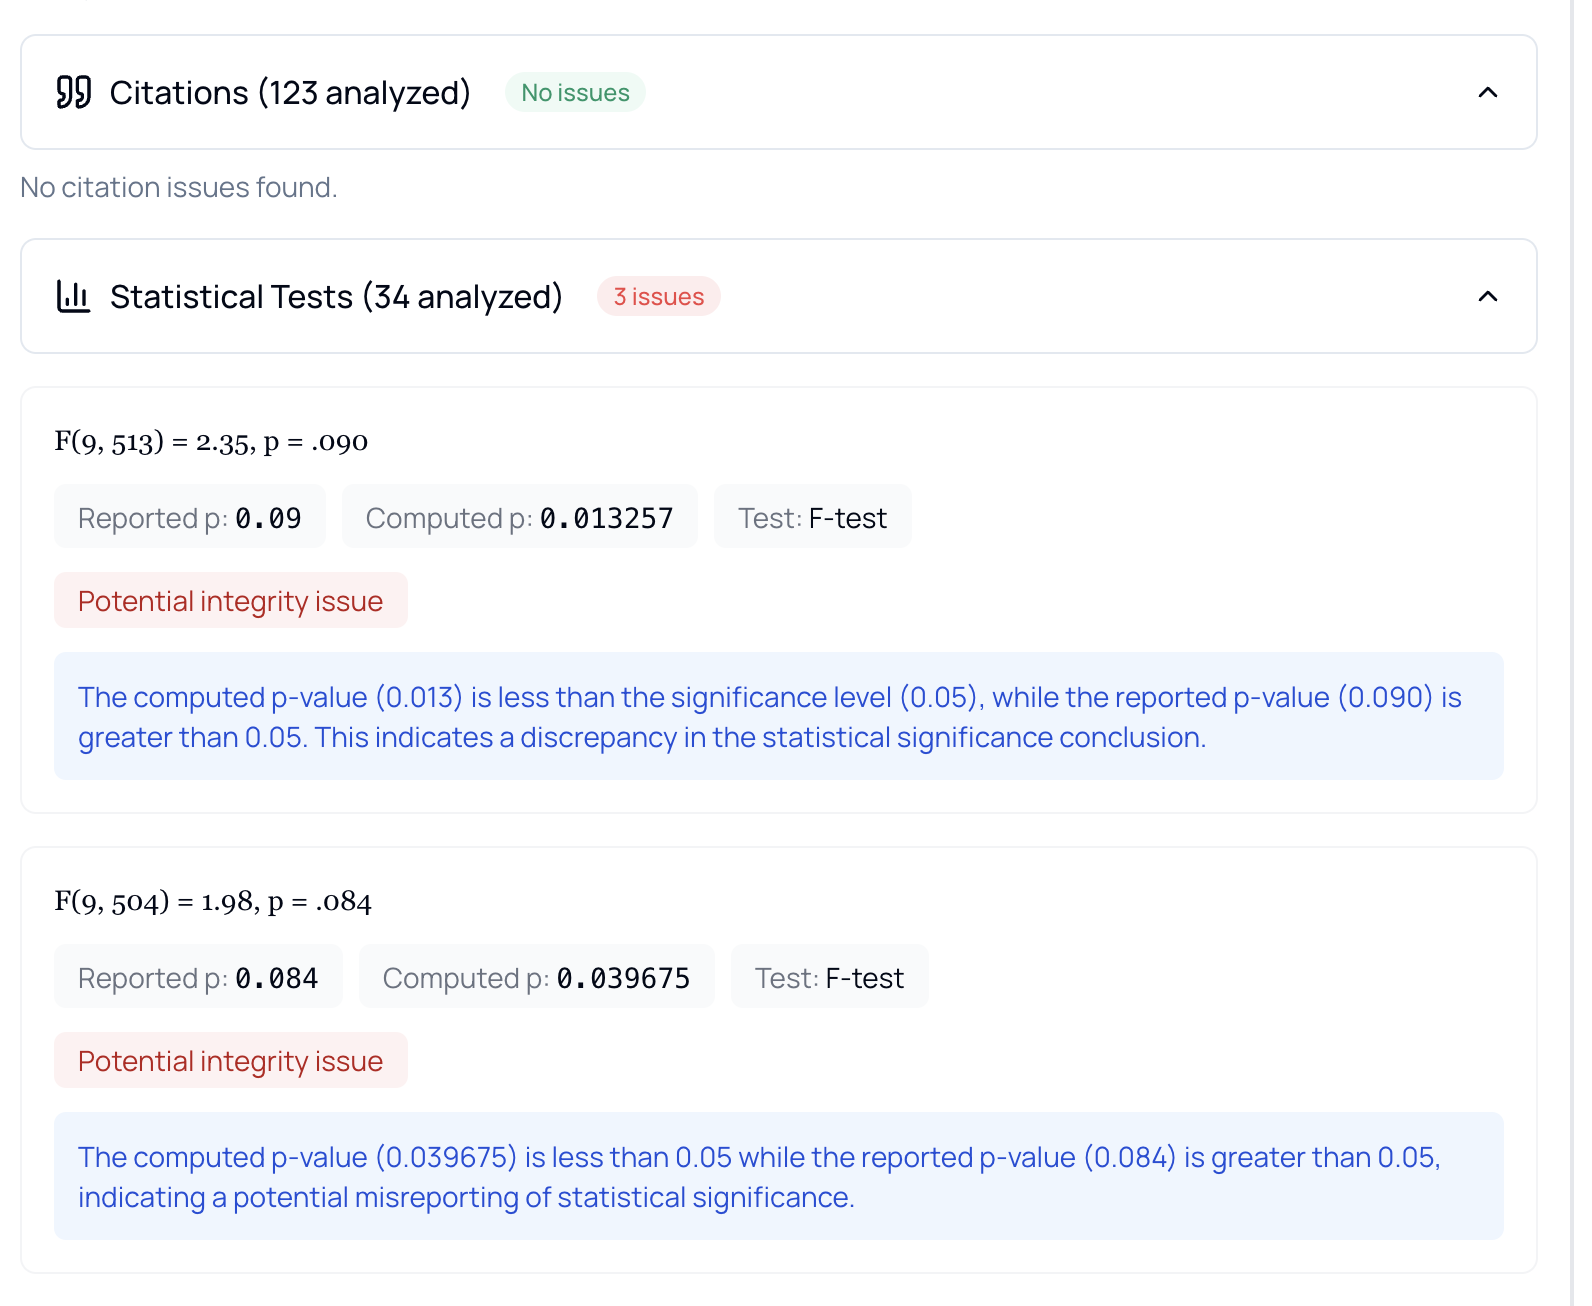 Statistical Overview
Dashboard Features
- Summary Counts - How many tests found vs. flagged
- Severity Distribution - Critical, warning, info levels
- Test Types - Breakdown by statistical test
- Quick Navigation - Jump to specific issues
Understanding P-Values
The p-value is the final step in a logical statistical process. To understand its power and fragility, you need to see how it's made.
The Null Hypothesis (H₀)
Science begins with a default, skeptical stance. For example: "The drug has no effect. Any difference we see is just random chance." The goal is to gather enough evidence to reject this skeptical view.
The Test Statistic
Researchers quantify their evidence with a test statistic—a single number summarizing how far their data deviates from the null hypothesis. Common examples:
| Test | Statistic | Use Case |
|---|---|---|
| t-test | t | Comparing two means |
| F-test | F | ANOVA, comparing variances |
| Chi-square | χ² | Categorical data |
| z-test | z | Large samples, known variance |
Degrees of Freedom
The test statistic's significance depends on degrees of freedom, which relate to sample size. A larger sample leads to a narrower, more "confident" distribution.
The P-Value Calculation
The p-value is the probability of observing a test statistic as extreme as (or more extreme than) the one found, assuming the null hypothesis is true.
If p = 0.0332, it means a result this strong would only happen 3.32% of the time if the null hypothesis were true.
Types of Checks
P-Value Verification
We verify that reported p-values are mathematically consistent with:
- Test statistics (t, F, z, r, chi-square, and more)
- Degrees of freedom — including inferring them from reported sample and group sizes when a paper omits them, so omnibus tests and correlations can still be verified
- Sample sizes
Effect Size and Confidence Interval Validation
Checking that effect sizes align with:
- Reported means and standard deviations
- Sample sizes
- Statistical test results
- Reported confidence intervals — including odds ratios, hazard ratios, and regression coefficients, where the test statistic is re-derived from the estimate and its interval
Confidence intervals are also checked for logical impossibilities, such as an estimate lying outside its own interval, or an interval that crosses the null while the result is reported as significant.
Metric Consistency
Reported performance metrics are cross-checked for internal consistency — for example, that RMSE is the square root of the reported MSE, that R² values are in range, and that claimed improvement percentages reproduce from the underlying numbers.
Methodology Review
An AI pass reviews the statistical methodology itself — flagging issues like inappropriate test choices or unsupported analytical claims. Methodology findings are only marked red when the issue demonstrably affects a primary conclusion and cannot be fixed by reanalysis; everything else surfaces as amber for your judgment.
Decimal Consistency
Detection of:
- Inconsistent decimal places
- Rounding errors
- Mathematically impossible values
Common Statistical Inconsistencies
The Vanishing Details Problem
The most common issue isn't calculation errors—it's missing information:
- P-values without test statistics
- Test statistics without degrees of freedom
- Conclusions without sample sizes
- Results buried in figures without extractable numbers
P-Hacking
Selective reporting or manipulation to achieve p < 0.05:
- Trying different statistical tests until one "works"
- Selectively reporting only significant results
- Adjusting analysis until threshold is crossed
Calculation Cascade
Sometimes numbers are all there, but they don't add up:
- P-values that don't match reported test statistics
- Degrees of freedom that don't align with sample sizes
- Test statistics that are mathematically impossible
Multiple Testing Mirage
Running many tests without correction:
- With α = 0.05, 1 in 20 tests is "significant" by chance
- Reporting only significant findings creates false positives
- Missing Bonferroni or other corrections
How It Works
Step 1: Text Extraction
Statistical values are extracted from the manuscript using AI:
- Parses text, tables, and figure captions
- Recognizes APA-style and other formats
- Handles non-standard reporting styles
Step 2: Pattern Recognition
Statistics are identified using ML-based pattern matching:
- Detects test statistics (t, F, χ², r, etc.)
- Identifies p-values in various formats
- Extracts degrees of freedom and sample sizes
Step 3: Validation
Each statistic is checked for internal consistency:
- Recalculate p-values from test statistics
- Verify mathematical relationships
- Check for impossible values
Step 4: Cross-Referencing
Related statistics are verified against each other:
- Means vs. standard deviations
- Sample sizes vs. degrees of freedom
- Effect sizes vs. test statistics
Understanding Reports
Issue Categories
| Category | Description | Example |
|---|---|---|
| Inconsistent | Values don't match mathematically | t(24)=2.1 yielding p=0.001 |
| Impossible | Values outside valid ranges | p=-0.05 or r=1.5 |
| Suspicious | Unusual patterns | All p-values exactly 0.05 |
| Incomplete | Missing required values | F statistic without df |
Confidence Levels
Each flagged issue includes a confidence indicator:
| Level | Meaning | Recommendation |
|---|---|---|
| High | Clear mathematical inconsistency | Requires correction |
| Medium | Likely error, needs verification | Investigate further |
| Low | Possible issue, may be reporting artifact | Review context |
Where We Find Statistics
Our system extracts and analyzes statistics from multiple locations throughout your manuscript:
Main Text
Statistics embedded in paragraphs and sentences are automatically detected:
- Inline statistical reports (e.g., "t(24) = 2.45, p = 0.02")
- Results sections with multiple test outcomes
- Discussion sections referencing statistical findings
Tables
Statistical values in tables are extracted and validated:
- Results tables with test statistics and p-values
- Summary statistics (means, standard deviations, sample sizes)
- Multi-column layouts with related values
Figures
Statistics in figure captions and annotations are also analyzed:
- Caption text containing statistical claims
- Annotations within figures
- Legend text with statistical information
Broader Format Support
Our system handles a wide variety of statistical reporting formats beyond standard APA style:
- Non-standard formats - Recognizes statistics reported in various styles
- Multiple notations - Handles different ways of expressing the same test
- Incomplete reporting - Detects when required statistical information is missing
Example Output
Minor Rounding Difference
Reported: t(28) = 2.45, p = 0.02
Computed: t(28) = 2.45, p = 0.021

Status: Minor rounding difference - acceptable
Confidence: Low
Significant Discrepancy
Reported: F(2, 45) = 3.21, p < 0.001
Computed: F(2, 45) = 3.21, p = 0.049

Status: Significant discrepancy - requires review
Confidence: High
Decision Error: Yes (would change significance conclusion)
Best Practices
Before Submission
- Run statistical checks on your final draft
- Address all high-confidence flags
- Verify degrees of freedom match sample sizes
- Report exact p-values when possible
For Reviewers
- Focus on decision-altering errors first
- Consider rounding conventions in the field
- Check for missing statistical information
- Request clarification for incomplete reports
Reporting Standards
To ensure statistical accuracy:
- Use statistical software to generate values
- Double-check all manually transcribed statistics
- Report exact p-values rather than inequalities
- Include degrees of freedom for all tests
- Provide sample sizes for each analysis
Related Resources
- AI Text Detection - Detect AI-generated text and plagiarism
- AI Review - Comprehensive manuscript assessment
- Citation Analysis - Reference verification
- Platform Features - Platform capabilities