Image Duplication Analysis
ReviewerZero's image analysis module uses advanced computer vision to detect potential issues in manuscript figures. Our AI-powered system can identify even subtle image manipulations that might otherwise go unnoticed.
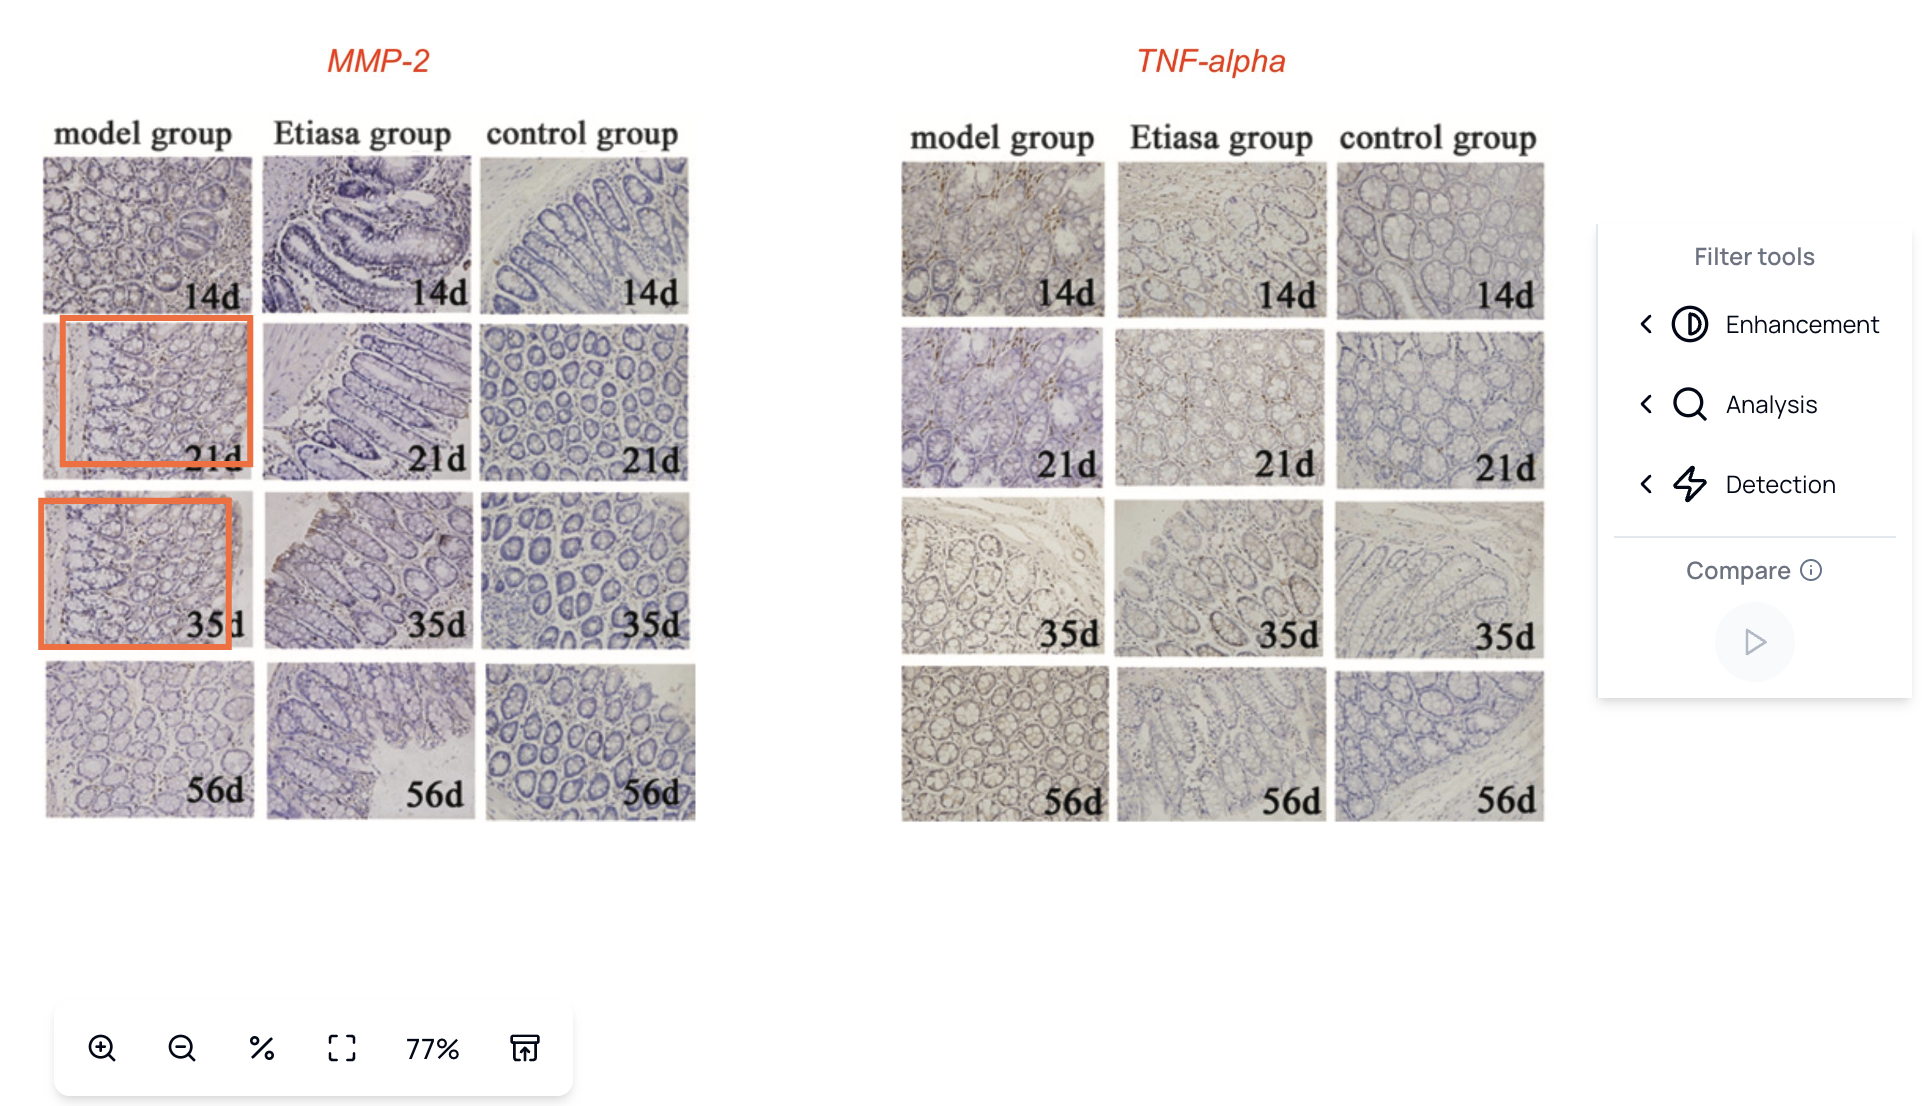
Smart Detection Display
Clear and intuitive display of detected image duplications. Our system highlights potential issues in an easy-to-understand format for efficient review.
 Smart Detection Display
What You See
- Visual Highlights - Matching regions clearly marked
- Confidence Scores - How certain the detection is
- Match Details - Transformation type (rotation, scale, etc.)
- Side-by-Side View - Compare matched regions easily
What We Detect
Duplicated Regions
Our algorithms identify when the same region appears multiple times within or across figures:
- Copy-paste manipulation - Identical regions used in different contexts
- Unintentional duplication - Accidental reuse of images
- Reuse of experimental data - Same data presented as different experiments
Rotated or Flipped Images
Detection of images that have been transformed:
- Rotation - Images rotated to any angle
- Horizontal flip - Mirror images
- Vertical flip - Inverted images
- Scaling - Resized to different dimensions
Splicing Inspection
Forensic filters that help reviewers visually inspect figures for possible splicing.
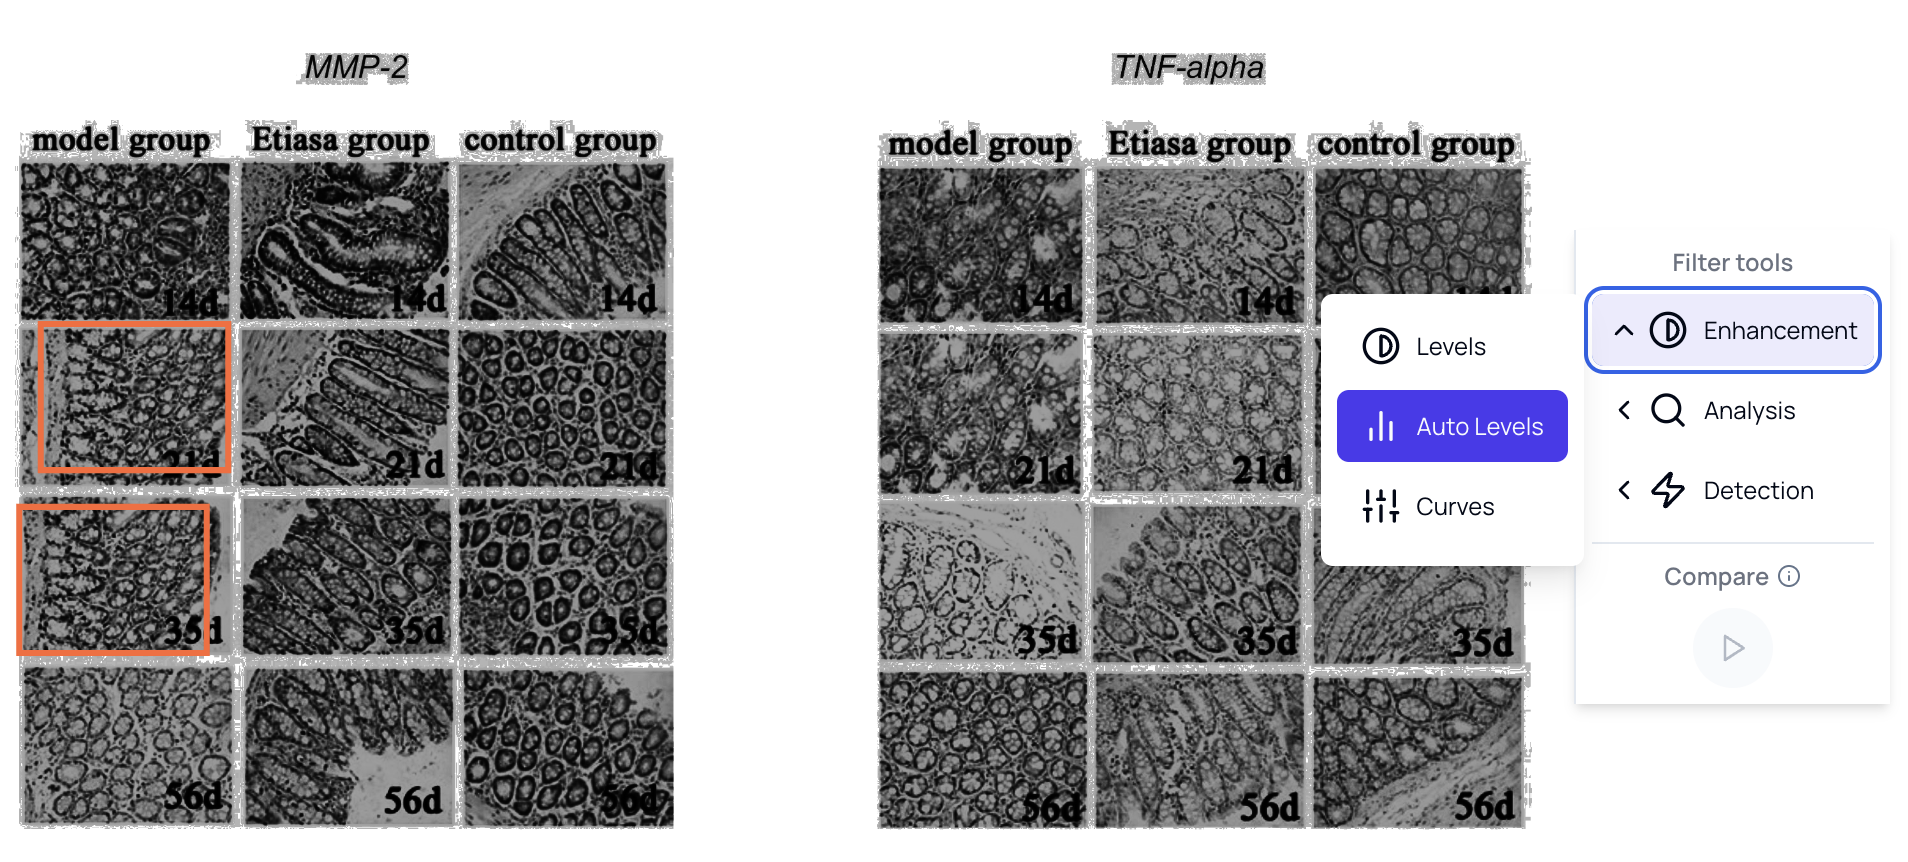
Enhanced Analysis Tools
Advanced image filters help enhance visibility of potential duplications and manipulations that might be difficult to spot with the naked eye.
 Enhanced Analysis Tools
Available Filters
| Filter | Purpose |
|---|---|
| Edge Enhancement | Highlight boundaries and structures |
| Contrast Boost | Make subtle differences visible |
| Color Mapping | Visualize intensity variations |
| Noise Analysis | Detect compression artifacts |
| ELA (Error Level Analysis) | Show editing traces |
Using Filters Effectively
- Start with Original - View unmodified image first
- Apply Enhancement - Use edge detection for structure analysis
- Check ELA - Look for inconsistent compression
- Compare Regions - Use overlays to spot differences
How It Works
Step 1: Figure Extraction
All figures are automatically extracted from the manuscript:
- PDF parsing extracts embedded images
- Page regions identified as figures
- Individual panels detected and separated
- Images normalized for consistent analysis
Step 2: Feature Analysis
Each image is processed to identify unique features:
- Keypoint Detection - Identify distinctive points
- Descriptor Extraction - Create feature signatures
- Region Segmentation - Divide into analyzable areas
- Pattern Recognition - Identify repeating elements
Step 3: Comparison
Features are compared within and across figures:
- Within-Figure - Check for internal duplications
- Cross-Figure - Compare against other figures in the manuscript
- Transformation Invariant - Detect matches regardless of rotation/scale
- Threshold Filtering - Apply confidence cutoffs
Step 4: Report Generation
Matches are highlighted with confidence scores:
- Match Pairs - Which regions match
- Similarity Score - How similar they are
- Transformation - What changes were applied
- Location - Page and figure references
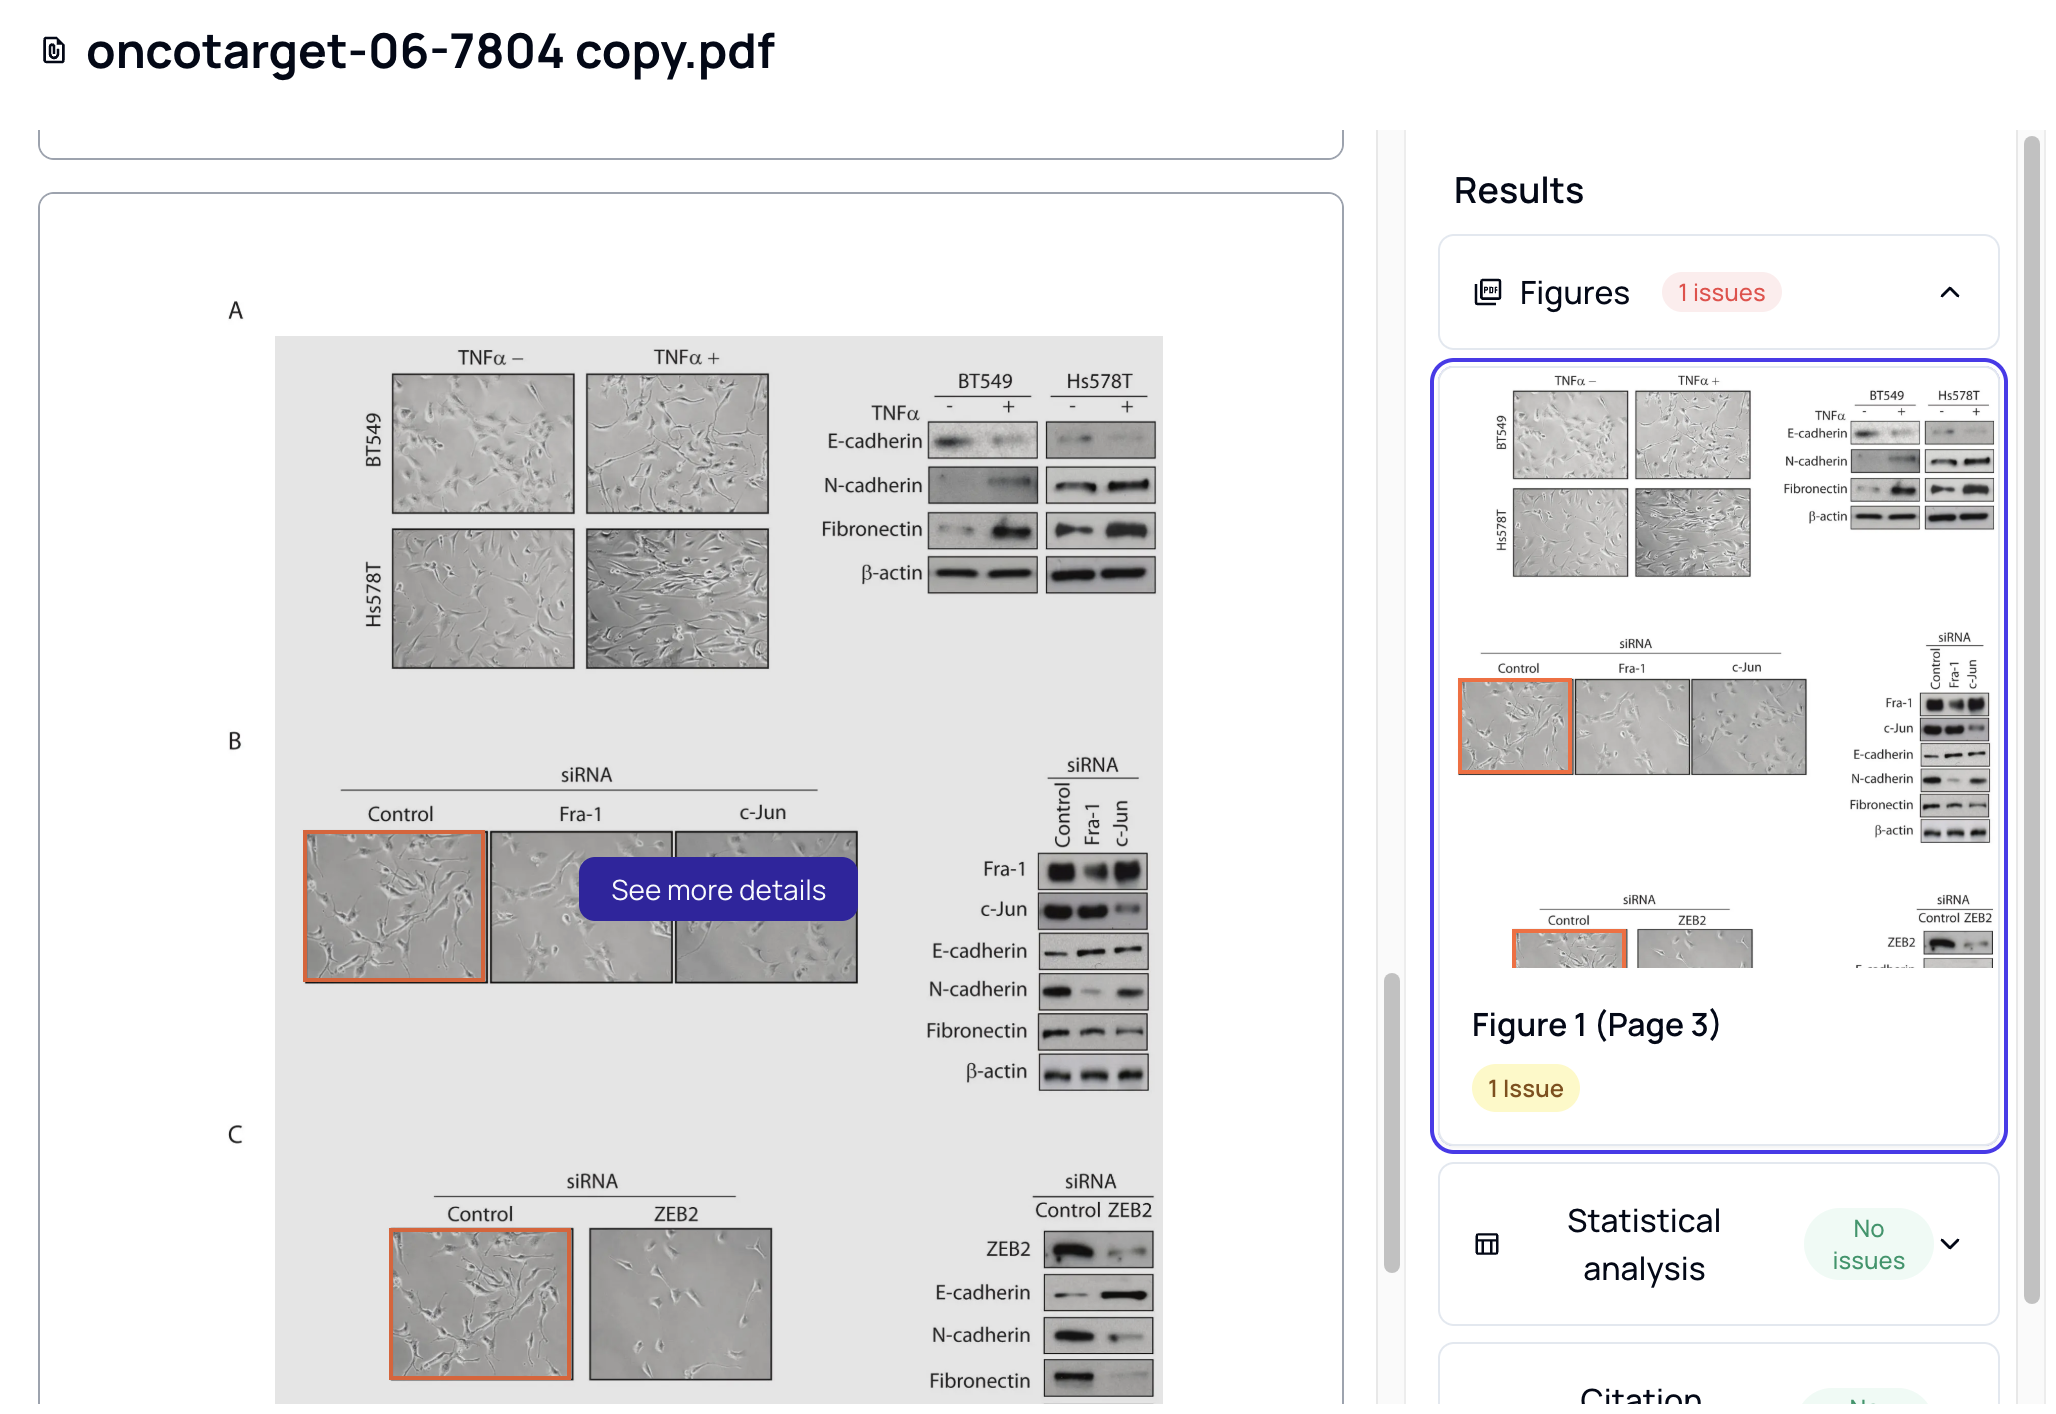
In-Context PDF Display
View detected issues directly within the manuscript context for easy reference.
 In-Context PDF View
Features
- Click on any figure to see analysis
- Highlights appear on the PDF directly
- Navigate between issues easily
- Access detailed analysis from context
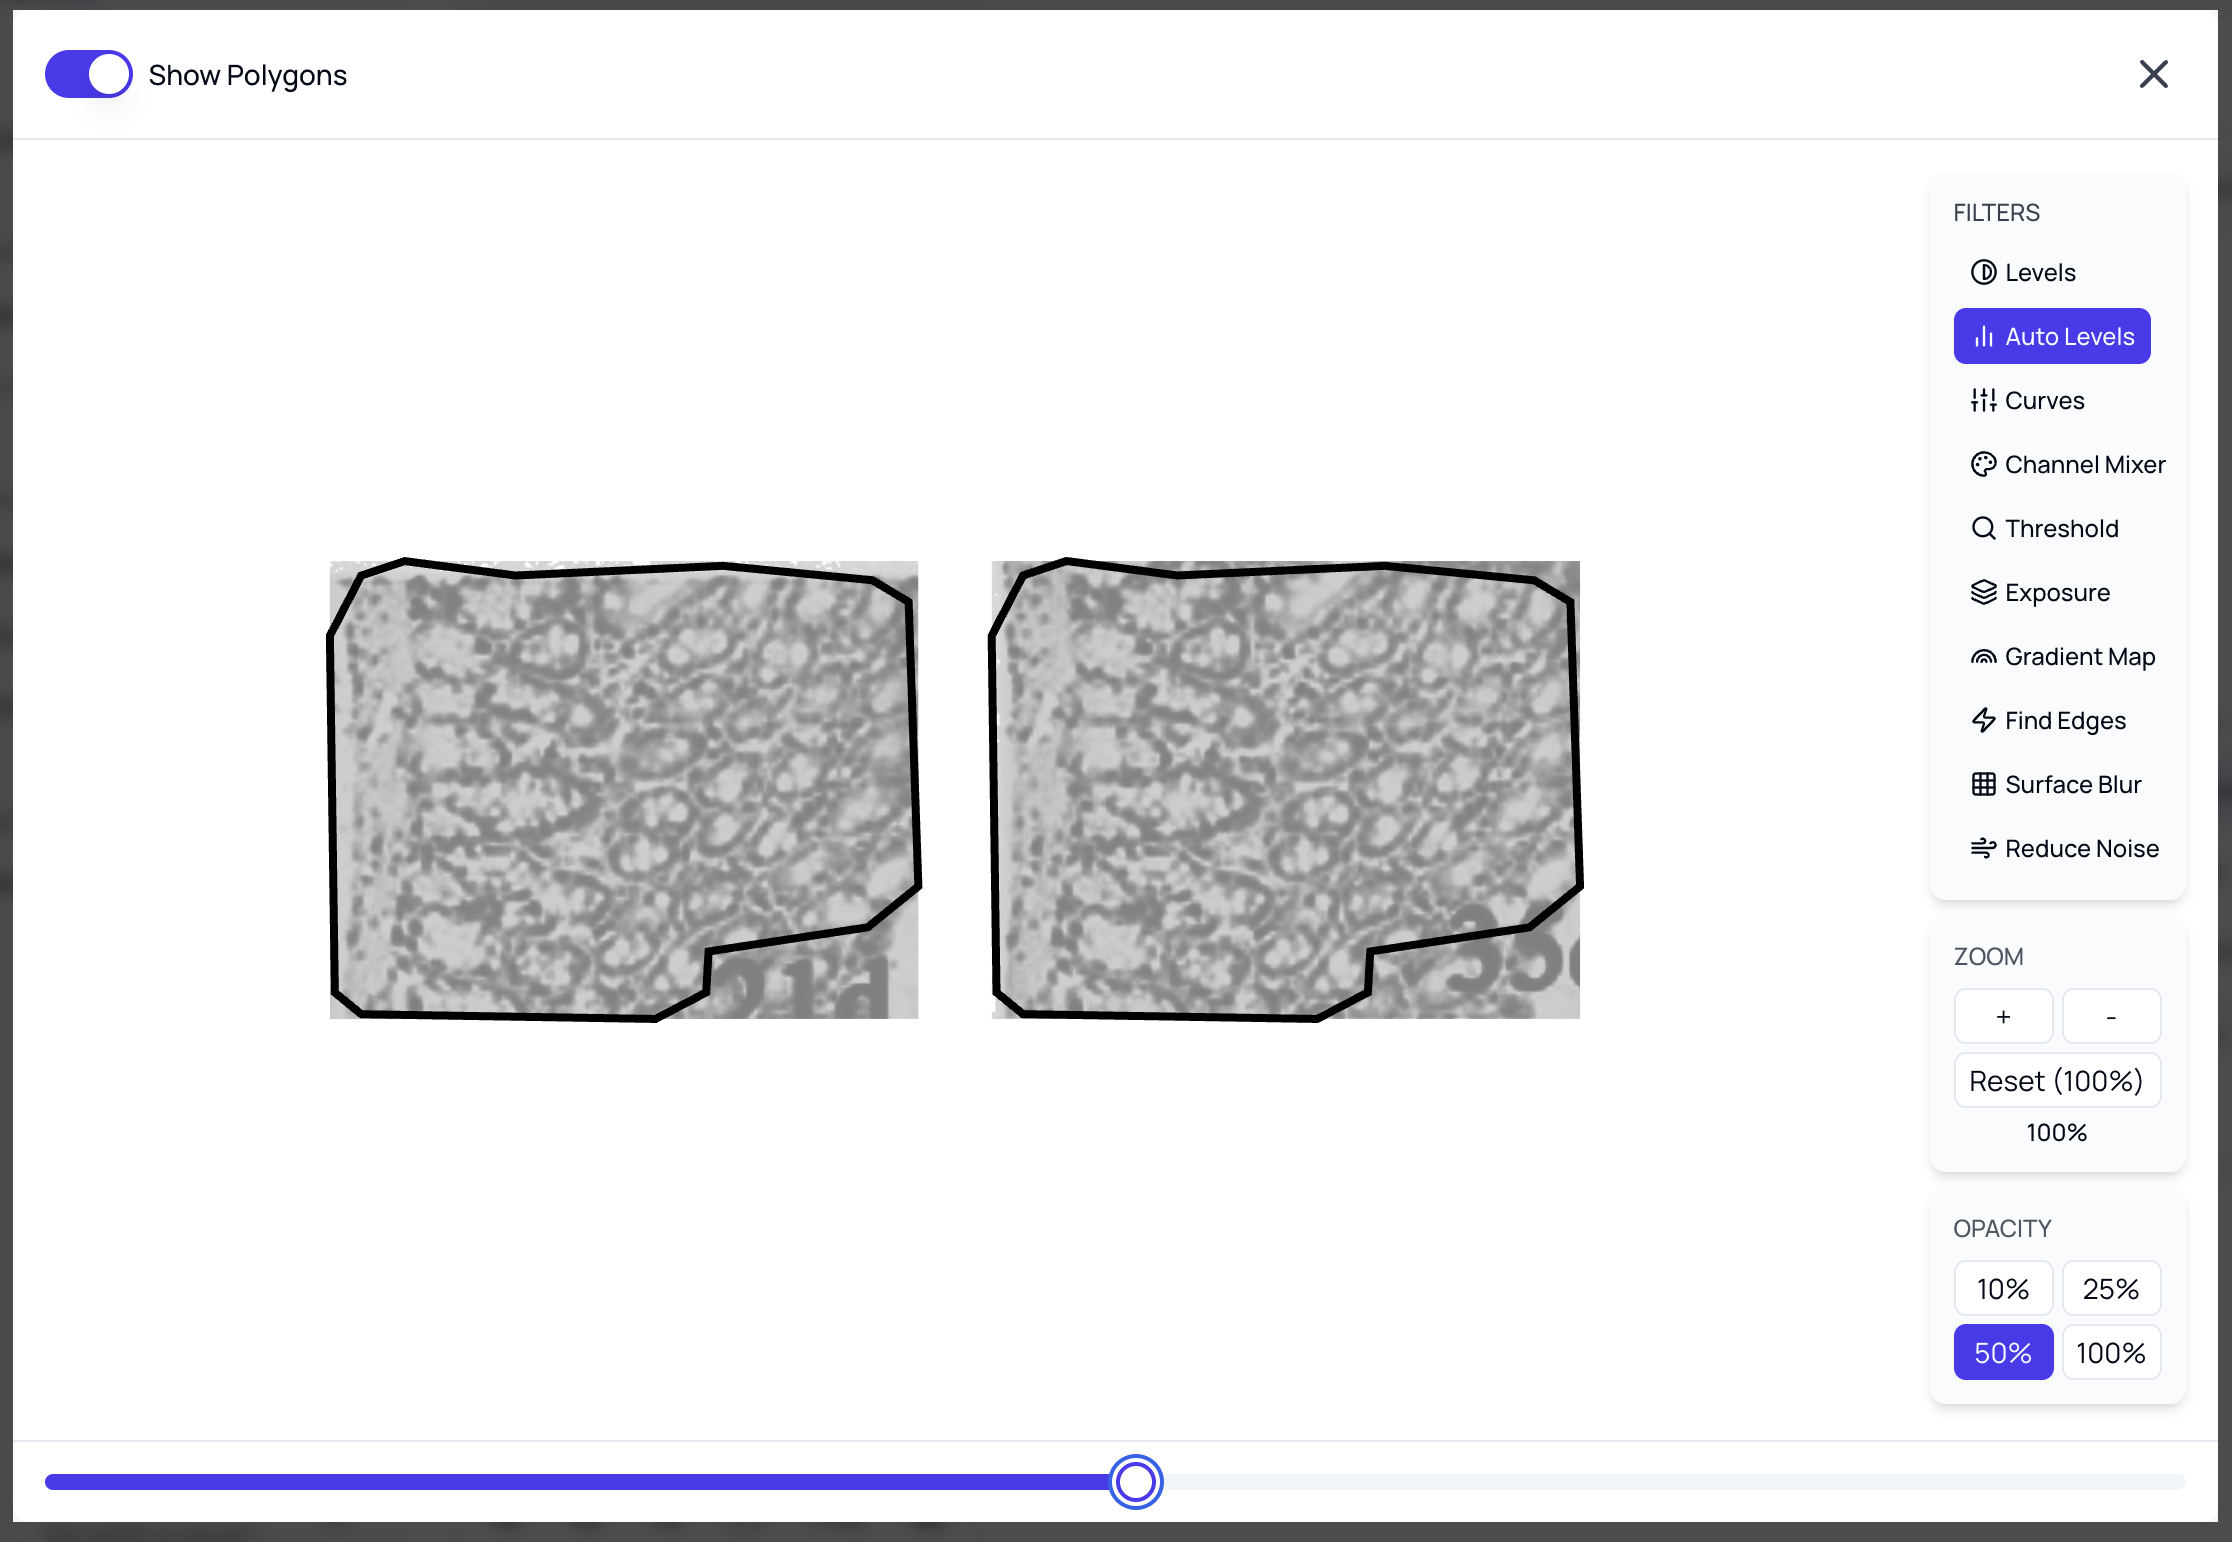
Detailed Comparison with Filters
Analyze potential matches with sophisticated visual tools that help human reviewers make informed decisions.
 Detailed Comparison with Filters
Comparison Tools
- Overlay - Stack images with adjustable opacity to see differences
- Animated A/B Comparison - Switch between two images
- Zoom - Inspect regions closely
- Forensic Filters - Enhance visibility of potential manipulations
Export & Share
Export your findings to PowerPoint with fully manipulable annotations for professional presentation.
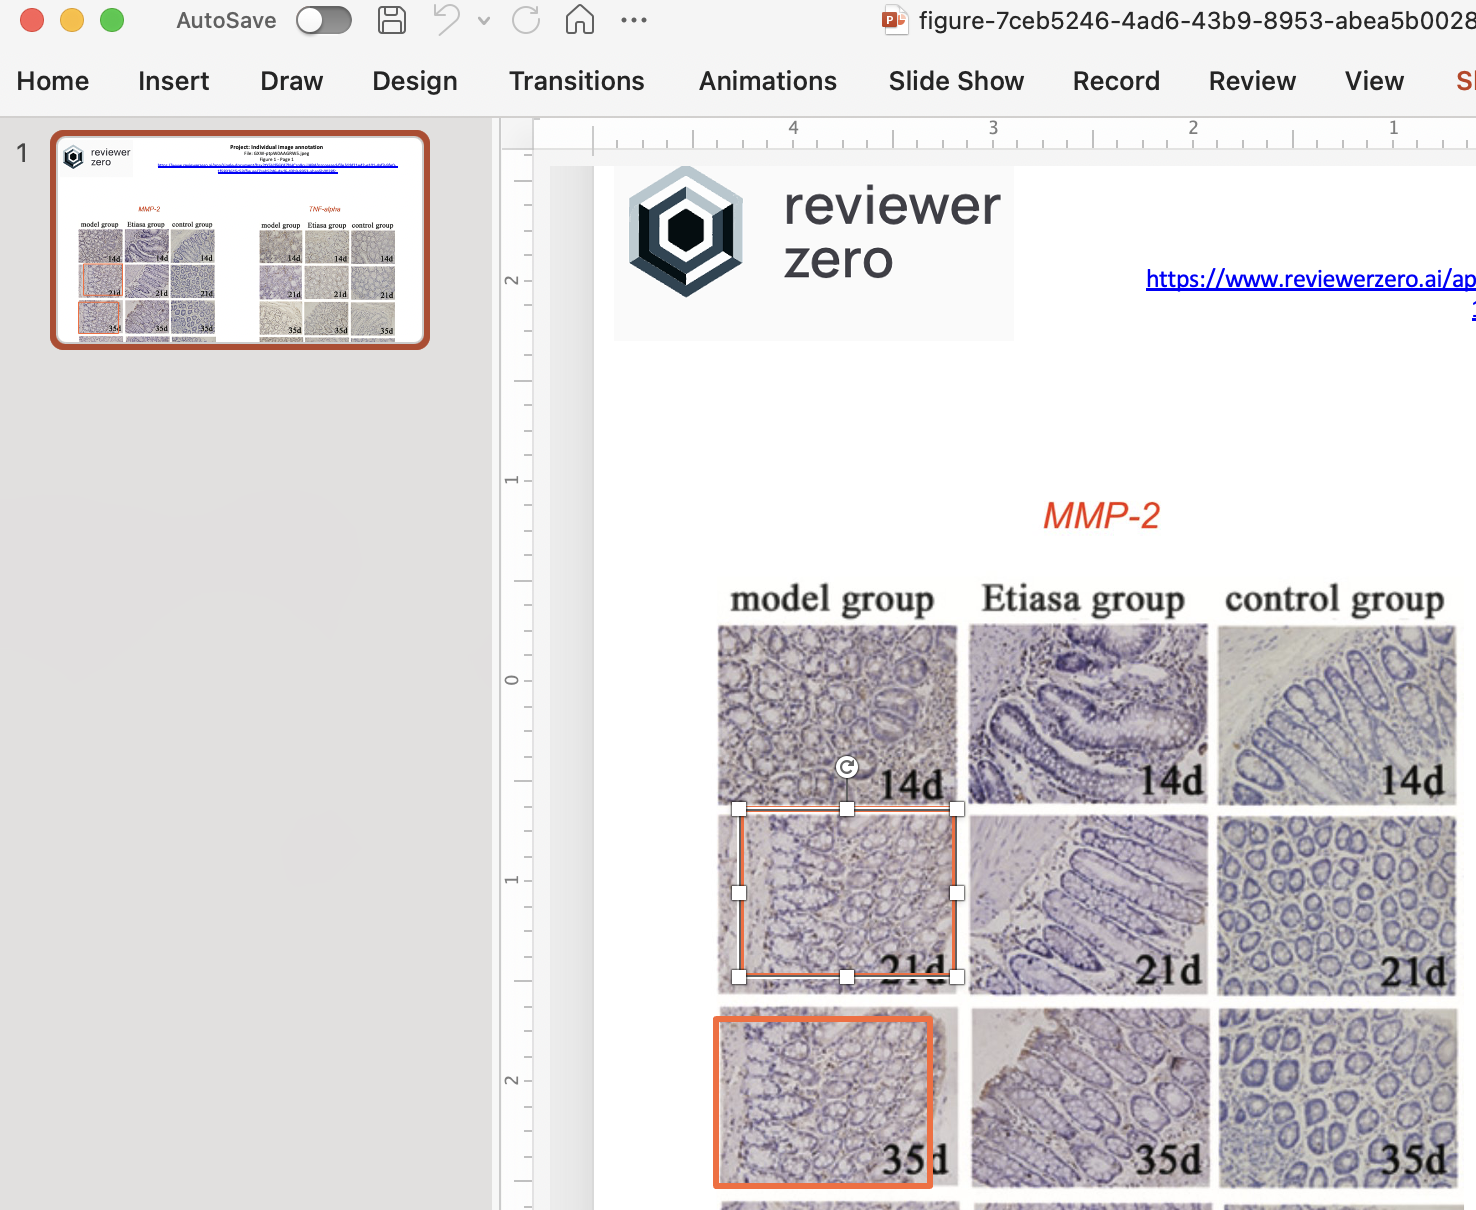 PowerPoint Export
Export Options
| Format | Use Case |
|---|---|
| PowerPoint | Presentations with editable annotations |
| PDF Report | Formal documentation |
| PNG/JPEG | Individual figure exports |
| JSON | Machine-readable results |
What's Included
- Original figures with annotations
- Match highlights and arrows
- Confidence scores and details
- Explanatory text and labels
Interpreting Results
Match Scores
Results include a similarity score:
| Score Range | Meaning | Action |
|---|---|---|
| 90-100% | Very high similarity | Likely duplication - investigate |
| 70-89% | Moderate similarity | May warrant investigation |
| 50-69% | Low-moderate similarity | Review context |
| Below 50% | Low similarity | Usually acceptable |
Visual Comparison
Each match includes:
- Side-by-side comparison
- Highlighted matching regions
- Transformation details (rotation, scale, etc.)
- Original page and location
False Positives
Some legitimate matches occur naturally:
- Loading controls - Intentionally identical controls
- Molecular markers - Same ladder across gels
- Template elements - Common experimental setups
- Scale bars - Standardized references
Always verify against experimental context.
Best Practices
Before Submission
- Run image analysis on your final draft
- Review all flagged matches
- Document legitimate reuse in figure legends
- Use unique identifiers for each experimental condition
For Reviewers
- Focus on high-confidence matches first
- Use filters to examine subtle issues
- Consider experimental context
- Document findings with exports
Avoiding Issues
- Avoid reusing control images across experiments
- Use distinct labels for each condition
- Keep original unprocessed images
- Document any intentional image reuse
Web Usage Detection
Check if figure components appear elsewhere online:
- Reverse image search across the web
- Cross-reference against online sources
- Stock image detection
- Previous publication identification
Figure Accessibility
Our platform analyzes figures for accessibility issues that could affect readability for all readers.
Low Contrast Detection
Identifies panels with insufficient contrast that may be difficult to read:
- Detects text and elements with poor contrast ratios
- Flags charts and graphs with hard-to-distinguish colors
- Panel-level analysis for precise identification
Color-Blind Safety
Analyzes whether figures use color combinations that are accessible to color-blind readers:
- Detects red-green color combinations that are problematic
- Identifies figures that rely solely on color to convey information
- Suggests improvements for better accessibility
Accessibility Results
For each figure, you'll see:
| Issue Type | Description |
|---|---|
| Low Contrast | Panels with insufficient contrast for readability |
| Color-Blind Unsafe | Color combinations that may be indistinguishable |
Accessibility findings can be reviewed and dismissed if they represent intentional design choices, with the ability to restore dismissed findings at any time.
Related Resources
- AI Image Detection - Detect AI-generated figures and verify provenance
- Platform Features - Platform capabilities
- Statistical Checks - Verify reported statistics